Harnessing Business Analytics: Tools You Need to Know
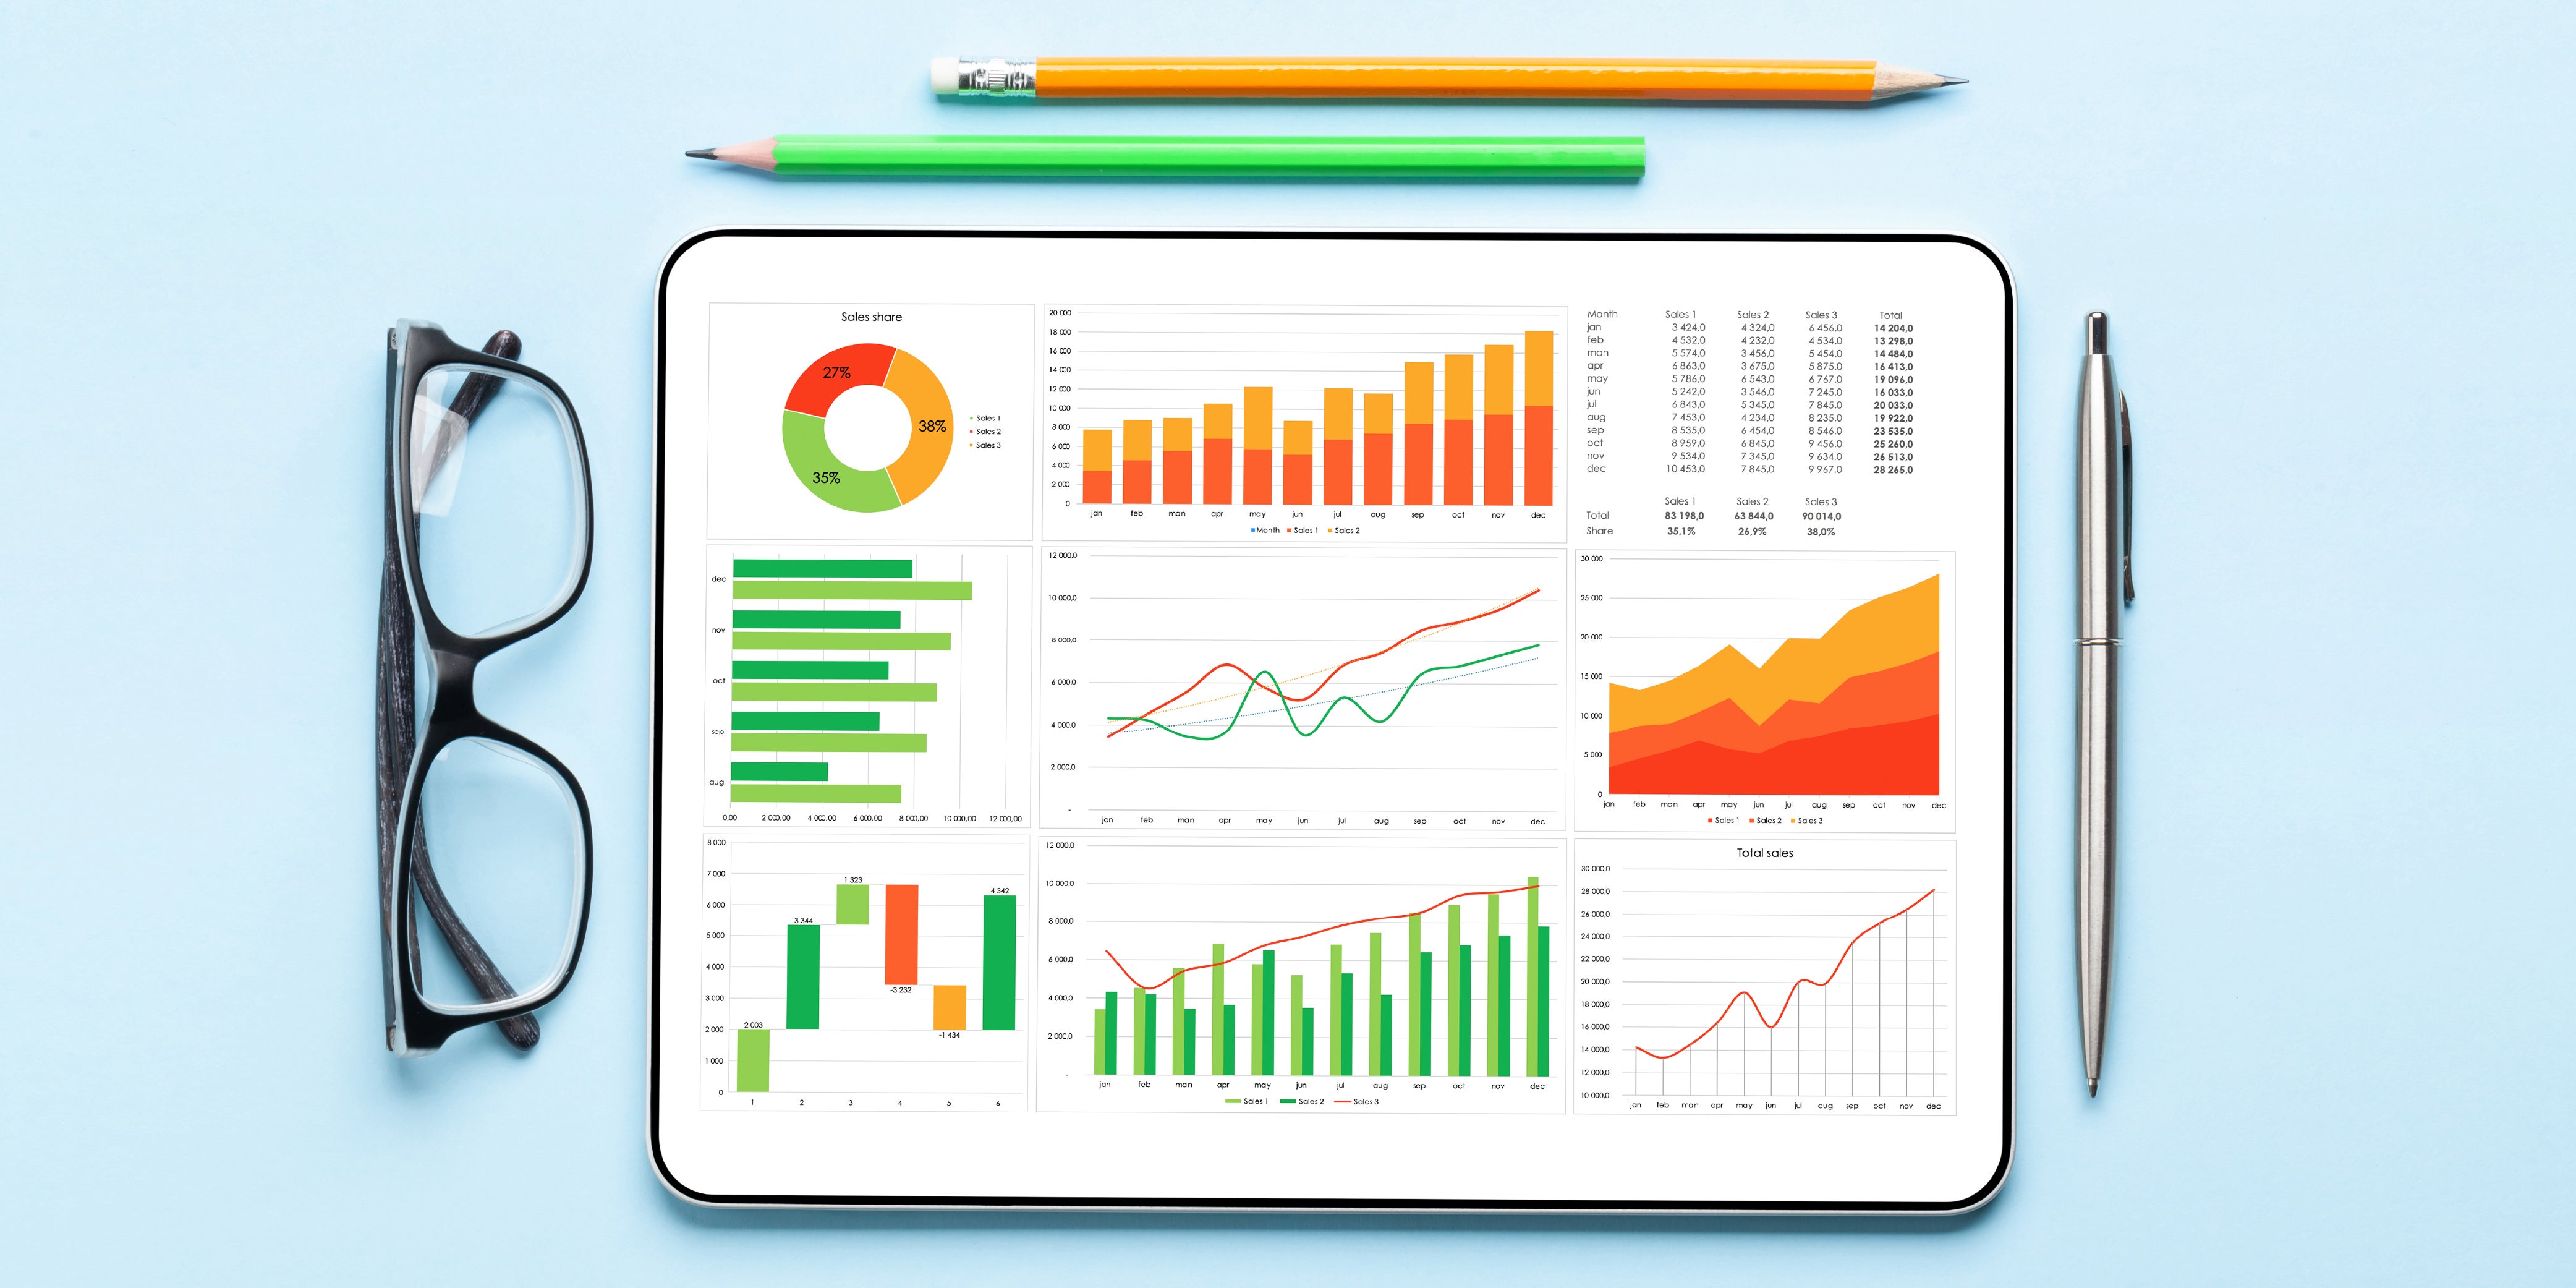
Modern businesses are overwhelmed by a vast amount of data, but the real challenge is extracting valuable insights from it. Each year, an enormous volume of information is generated, presenting significant growth opportunities for companies that can effectively harness its potential.
The key to unlocking this lies in utilising powerful analytics tools that enable teams to transform raw data into actionable intelligence, driving data-informed decision-making at every level. This allows businesses to quickly adapt to market changes, identify profitable growth opportunities, and make informed decisions that foster success.
Consider companies like Netflix, IKEA, and Maybank, which employ advanced analytics tools to gain a competitive advantage. By doing so, they enjoy benefits such as enhanced operational efficiency, improved customer engagement, and a robust market position, enabling them to stay ahead of the competition.
7 Business Analytics Tools That Every Aspiring Analyst Needs to Know
The business analytics tools market is a vast and dynamic landscape, catering to a diverse range of needs and skill levels. With new innovations emerging daily, navigating the numerous options available can be overwhelming.
However, some platforms distinguish themselves by providing exceptional capabilities to help users unlock the full potential of their data. Below are the top 7 tools that currently stand out in the market.
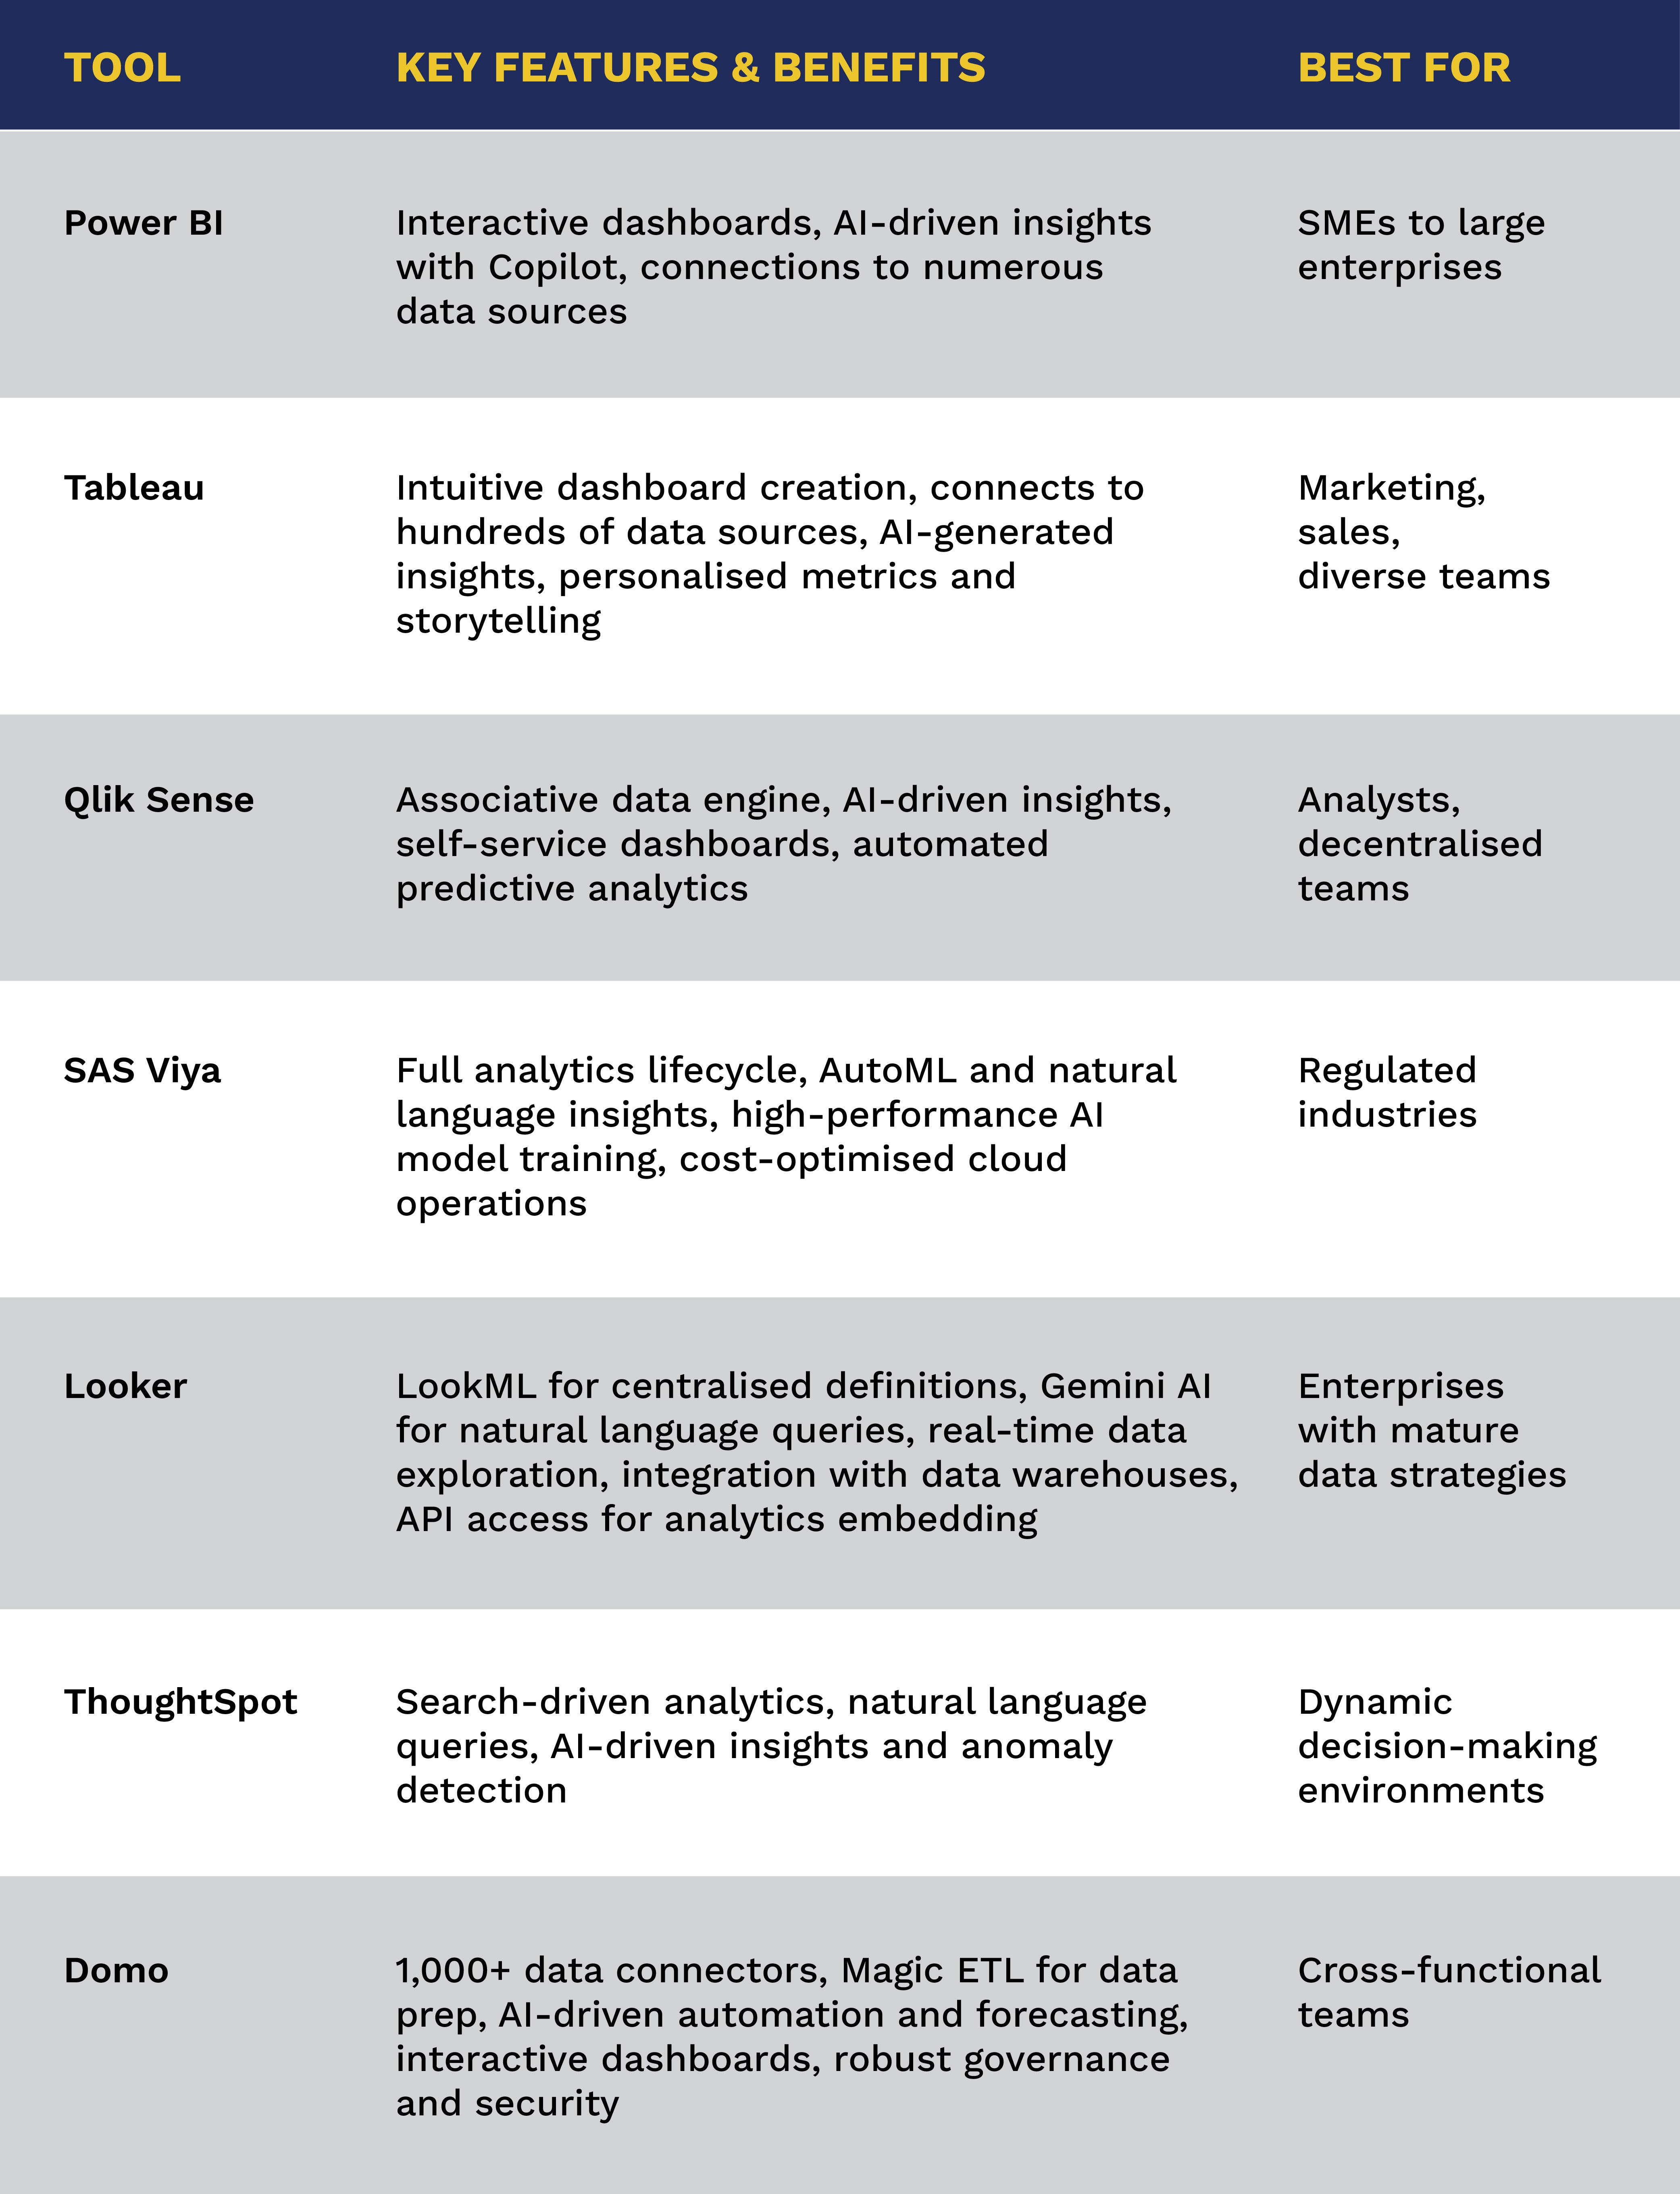
1. Power BI
Power BI is a widely recognised business intelligence platform offering robust self-service analytics and deep integration with the Microsoft ecosystem (Excel, Azure, Teams). It provides a unified analytics experience.
Key Features & Benefits:
- Creates interactive dashboards and advanced reporting features.
- Leverages AI for quick insights using features like Copilot.
- Able to connect to hundreds of data sources.
Best For: Organisations of all sizes already invested in the Microsoft ecosystem, business analysts, and non-technical users needing self-service analytics and compelling visualisations.
Example: An operations manager uses a Power BI dashboard with real-time supply chain data to monitor delivery times, identify bottlenecks, and analyse fuel efficiency.
2. Tableau
Tableau is a leading data visualisation platform known for turning complex datasets into engaging, easy-to-understand visual stories. It empowers users to explore, analyse, and communicate insights through interactive dashboards.
Key Features & Benefits:
- Intuitive dashboard creation and data visualisation
- Connects to hundreds of data sources
- Delivers AI-generated insights and natural language explanations
- Enables personalised metrics and storytelling
Best For: Business users, analysts, and researchers who need to craft compelling data narratives across marketing, sales, or academic functions. Ideal for teams of all skill levels seeking visual clarity and real-time performance tracking.
Example: A marketing manager blends sales data, CRM demographics, and web analytics to track campaign ROI, segment customers, and optimise acquisition strategies in real time.
3. Qlik Sense
Qlik Sense stands out with its Associative Engine, enabling free-form data exploration that uncovers connections and insights that might be missed by traditional, query-based BI tools. It supports deep, real-time analytics and intuitive data discovery beyond linear query paths.
Key Features & Benefits:
- Associative data engine for unrestricted exploration
- AI-powered insights and suggestions
- Self-service dashboards and visualisations
- Predictive analytics via automated machine learning
Best For: Analysts and decision-makers needing complex, ad-hoc data discovery. Suited for industries like finance or logistics where understanding subtle data patterns is crucial.
Example: A financial firm uses Qlik Sense to analyse transactional and market data, uncovering fraud patterns that rule-based systems might overlook—improving detection rates and reducing losses.

4. SAS Viya
SAS Viya is a cloud-native analytics platform built for enterprises needing advanced statistical modelling, machine learning, and end-to-end AI lifecycle support. It offers integration with both SAS and open-source languages.
Key Features & Benefits:
- Complete analytics lifecycle, including data prep, visualisation, model development and deployment
- AutoML, natural language insights, and scenario analysis
- High-performance AI model training
- Cost-optimised cloud operations
Best For: Large enterprises and organisations in regulated sectors like banking, healthcare, and insurance. Ideal for data science teams requiring secure, high-performance analytics at scale.
Example: A bank uses SAS Viya to streamline stress testing, enabling faster, compliant decision-making, and stronger risk management.
5. Looker
Now part of Google Cloud, Looker delivers governed analytics through its semantic modelling layer, LookML. It ensures consistent metrics across teams and supports embedded analytics within applications and workflows.
Key Features & Benefits:
- Centralised definitions via LookML
- Natural language queries powered by Gemini AI
- Real-time data exploration with governed consistency
- Seamless integration with Google BigQuery and other data warehouses
- API access for embedded analytics
Best For: Organisations prioritising data governance, embedded analytics, or productised data experiences. Especially suited for teams leveraging Google Cloud infrastructure.
Example: A website builder integrates Looker into its platform, enabling users to monitor web traffic and e-commerce performance without leaving the interface.
6. ThoughtSpot
ThoughtSpot is an AI-driven analytics platform that enables users to generate insights and explore data using natural language processing (NLP) or natural language query (NLQ).
Key Features & Benefits:
- Natural language search for instant, visual answers
- AI-powered insights and anomaly detection
- Live querying from cloud data warehouses
Best For: Business leaders and frontline teams in need of rapid, ad-hoc insights. Ideal for fast-moving industries where speed and accessibility of data are critical.
Example: A retailer uses ThoughtSpot to monitor real-time shifts in customer demand, helping supply chain teams adapt quickly during disruptions.
7. Domo
Domo is an end-to-end cloud-native platform for data integration, analytics, and custom app development. It combines robust governance with user-friendliness, supporting scalable insights across teams.
Key Features & Benefits:
- 1,000+ pre-built data connectors
- Magic ETL for drag-and-drop data prep
- AI-powered automation and forecasting
- Interactive dashboards and app creation
- Strong governance and role-based security
Best For: Organisations looking to consolidate their data stack and empower business units through self-service analytics. Ideal for building embedded solutions and automating workflows with AI.
Example: A healthcare provider uses Domo to automate admin tasks and deliver real-time insights, boosting productivity while enabling personalised care.

Master of Business Analytics: Take Your Skills to the Next Level
True mastery in the age of analytics extends beyond operational proficiency with specific tools. It demands a deeper understanding of data principles, analytical methodologies, statistical rigour, and, most importantly, the strategic acumen to translate insights into tangible business outcomes.
This is where advanced education, such as a Master of Business Analytics, becomes a critical differentiator for ambitious professionals seeking to lead in this data-driven era as it can equip you with the skills and knowledge sought by leading employers. Learn more by downloading the programme guide or schedule a call with our Education Counsellors to discover how to shape your future in analytics.